Homes in Hilltop, Denver
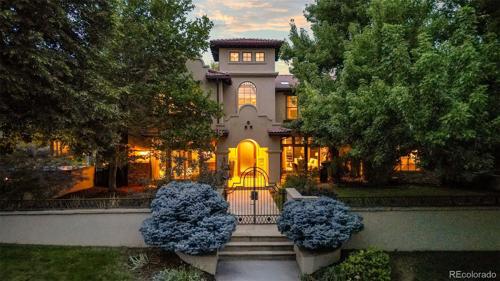
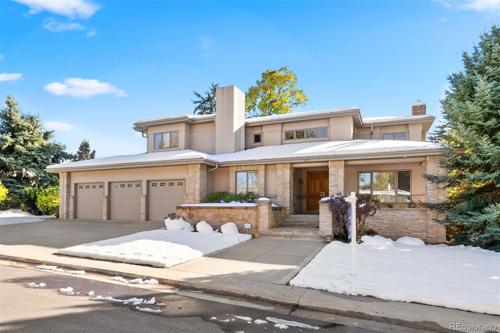
Hilltop is filled with excitement and energy. Homeowners in Hilltop are transforming this very diverse area. Smaller homes are being remodeled to accommodate contemporary open floorplans. Buyers who are building new homes in place of homes that have been razed are using smaller footprints that respect the site and the neighborhood. Architects, builders and homeowners alike have realized that you can have exciting architecture and modern, functional homes in a smaller space.
Hilltop is located just east of Cherry Creek North. Established from the 1930’s through the 1960’s, the neighborhood showcases stately architecture from Tudors to mid-century modern ranches. Over the years, Hilltop has gone through transformations that have included tearing down older homes in favor of larger “McMansions.” Today, however, the ongoing transformation is much more purposeful and in tune with the neighborhood’s history and aesthetics.
Hilltop will continue to evolve while offering a balance between grand stately homes and new builds that are be on a smaller scale. Buyers and sellers alike have discovered their voice and resources for improving the incredible Hilltop lifestyle.
List of Zipcodes in Homes in Hilltop, Denver
| Zip Code | Zip Code Name | Zip Code Population |
|---|---|---|
| 80220 | Denver | 37,329 |
| 80224 | Denver | 19,518 |
| 80246 | Denver | 14,855 |
Source: Census Bureau
Demographics
State
Colorado
County
Denver County
City
Denver
Population
734,508
| Zip Code | City | County | State | National | |
|---|---|---|---|---|---|
| Population | 37,329 | 734,508 | 734,331 | 5,759,582 | 331,426,769 |
| Population Density | 7,121.8 | 4,794.0 | 4,799.5 | 55.5 | 93.8 |
| Percent Male | 49.0% | 50.0% | 50.0% | 49.0% | 49.0% |
| Percent Female | 51.0% | 50.0% | 50.0% | 51.0% | 51.0% |
| Median Age | 40.6 | 37.6 | 37.6 | 40.2 | 39.0 |
| People per Household | 2.1 | 2.2 | 2.2 | 2.8 | 2.6 |
| Median Household Income | $79,927 | $69,660 | $69,646 | $115,942 | $61,963 |
| Average Income per Capital | $57,223 | $45,195 | $45,172 | $50,725 | $33,235 |
Source: Census Bureau
Market Data
| Zip Code | City | County | State | National | |
|---|---|---|---|---|---|
| Median Sale Price | $505,611 | $485,000 | $485,000 | $425,100 | $277,796 |
| Median Age of Home | 74.0 | 56.0 | 56.0 | 39.0 | 49.0 |
| Homes Owned | 53.0% | 46.0% | 46.0% | 67.0% | 58.0% |
| Homes Rented | 40.0% | 46.0% | 46.0% | 23.0% | 31.0% |
| Homes Vacant | 7.0% | 7.0% | 7.0% | 4.0% | 11.0% |
Sources: Census Bureau / Homendo
Source: REcolorado
This free service is provided by your local Agent
How much is your Home worth? Click here to know...
Review current market value estimates for your home, or anyone else, anywhere in the USA.
51 properties on market in Homes in Hilltop, Denver
 Pending
Residential
MLS# 5176071 | 2025-07-13T00:22:16.878Z
 Active
Residential
MLS# 7460355 | 2025-07-12T21:05:22.048Z
 Active
Residential
MLS# 4706616 | 2025-07-12T20:05:26.088Z
 Active
Residential
MLS# 9377824 | 2025-07-12T19:05:20.030Z
 Active
Residential
MLS# 2597678 | 2025-07-12T19:05:18.723Z
 Active
Residential
MLS# 2995140 | 2025-07-12T00:01:35.521Z
 Pending
Residential
MLS# 2252178 | 2025-07-11T18:12:16.489Z
 Active
Residential
MLS# 7581013 | 2025-07-11T14:35:16.428Z
 Pending
Residential
MLS# 9426634 | 2025-07-10T20:29:16.471Z
This free service is provided by your local Agent
Need more listings? Click here to search now...
15 minutes updated and accurate properties direct from your local agent. Home Evaluation. Get Loan Pre-Qualified.
Mary Ann Hinrichsen
RE/MAX Professionals
6020 Greenwood Plaza Boulevard
Greenwood Village, CO 80111, USA
6020 Greenwood Plaza Boulevard
Greenwood Village, CO 80111, USA
- (303) 548-3131 (Mobile)
- Invitation Code: new-today
- maryann@maryannhinrichsen.com
- https://MaryannRealty.com
Contact Me
Quality of Life
Cost of Living
88.0
Health Cost Index
98.0
Commute Time
22.0
Working from Home
4.0%
| Zip Code | City | County | State | National | |
|---|---|---|---|---|---|
| Cost of Living Index | 88.0 | 86.0 | 86.0 | 110.0 | 100.0 |
| Health Cost Index | 98.0 | 96.0 | 96.0 | 119.0 | 100.0 |
| Commute Time | 22.0 | 24.0 | 24.0 | 25.0 | 24.8 |
| Commuting by Bus | 10.0% | 9.0% | 9.0% | 1.2% | 2.1% |
| Commuting by Carpool | 11.0% | 14.0% | 14.0% | 11.0% | 13.5% |
| Commuting by Auto | 74.0% | 73.0% | 73.0% | 80.0% | 79.1% |
| Working at Home | 4.0% | 4.0% | 4.0% | 5.2% | 4.7% |
Source: Census Bureau
Walk Score®
Source: Walk Score®
Climate & Environment
January Average Low Temperature
15.2 °F
July Average High Temperature
88.0 °F
Annual Precipitation (inch)
16 inches
| Zip Code | City | County | State | National | |
|---|---|---|---|---|---|
| January Average Low Temperature | 15.2 °F | 15.2 °F | 15.2 °F | 13.7 °F | 22.6 °F |
| July Average High Temperature | 88.0 °F | 88.0 °F | 88.0 °F | 77.5 °F | 86.1 °F |
| Annual Precipitation (inch) | 16 in. | 16 in. | 16 in. | 19 in. | 38 in. |
Source: NOAA Climate
Schools & Education
Source: Great Schools
Safety & Crime
Violent Crimes
282.8
Property Crimes
1,634.5
| Zip Code | City | County | State | National | |
|---|---|---|---|---|---|
Violent CrimesCalculated annually per 100,000 residents |
|||||
| Assault | 148.4 | 204.6 | 476.6 | 246.3 | 250.2 |
| Murder | 7.6 | 2.5 | 9.2 | 3.8 | 5.0 |
| Rape | 72.2 | 71.4 | 97.8 | 67.2 | 42.6 |
| Robbery | 54.6 | 64.4 | 165.3 | 63.6 | 81.6 |
Property CrimesCalculated annually per 100,000 residents |
|||||
| Burglary | 682.4 | 347.5 | 544.2 | 348.4 | 340.5 |
| Theft | 338.4 | 1,840.0 | 2,473.0 | 1,858.3 | 1,549.5 |
| Motor Vehicle Theft | 613.7 | 603.4 | 726.3 | 384.0 | 219.9 |
Source: FBI - Crime Data Explorer


 Menu
Menu


